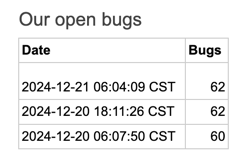
Engineering metrics are essential for tracking your team’s progress and productivity and identifying areas for improvement. However, manually collecting and updating these metrics can be time-consuming and error-prone. In this article, we will show you how to automate the tracking of engineering metrics and visualize them in the Google Office suite.
Some standard engineering metrics include:
- Number of bugs
- Lead time for changes (or bug fixes)
- Code coverage
- Build/test success rate
- Deployment frequency
- Number of incidents
- Mean time to recovery
- Delivered story points
- and many more
Engineering metrics can be further sliced and diced in various ways. For example, you can track bugs by severity or on a per-team basis.
Building an engineering metrics tracker
For our example metrics tracker, we will gather the number of GitHub open bugs for a team, update the numbers in a Google Sheet, automate the process with GitHub Actions, and display the data in Google Docs.
All the tools for this flow are freely available, and this process does not rely on costly third-party metrics-gathering services. We will use the Go programming language in our example.
Gathering the number of open bugs
The GitHub API is a well-documented way to query issues in a repository.
There are also many quality client libraries for the API. We will use the go-github client.
Create a git repository and set up a new Go module. Here is our code snippet to get the number of open bugs:
import (
    "github.com/google/go-github/v67/github"
)

func getGitHubIssues(ctx context.Context) ([]*github.Issue, error) {
    githubToken := os.Getenv("GITHUB_TOKEN")
    client := github.NewClient(nil).WithAuthToken(githubToken)

    // Get issues.
    var allIssues []*github.Issue
    opts := &github.IssueListByRepoOptions{
       State:  "open",
       Labels: []string{"#g-mdm", ":release", "bug"},
    }
    for {
       issues, resp, err := client.Issues.ListByRepo(ctx, "fleetdm", "fleet", opts)
       if err != nil {
          return nil, err
       }
       allIssues = append(allIssues, issues...)
       if resp.NextPage == 0 {
          break
       }
       opts.Page = resp.NextPage
    }
    return allIssues, nil
}
The above code snippet uses a GITHUB_TOKEN environment variable to authenticate with the GitHub API. You can create a
personal access token in your GitHub account settings. Later, we will show how to set this token in GitHub Actions
automatically. The token is optional for public repositories but required for private repositories.
The code snippet queries the open issues in the public fleetdm/fleet repository with the labels #g-mdm, :release,
and bug. Fleet’s MDM product team currently uses these labels for bugs in progress or ready to be worked on.
Updating the Google Sheets spreadsheet
To update the Google Sheets spreadsheet, we will use the Google Sheets API with the Google’s Go client library.
For instructions on getting a Google Sheets API key, sharing the spreadsheet with a service account, and editing the spreadsheet using the API, see our previous article: How to quickly edit Google Sheets spreadsheet using the API.
See our integrated function to update the Google Sheets spreadsheet with the number of open bugs on GitHub.
In our example, we get the spreadsheet ID and the service account key from environment variables. When running locally,
you must set the SPREADSHEET_ID and GOOGLE_SERVICE_ACCOUNT_KEY environment variables.
spreadsheetId := os.Getenv("SPREADSHEET_ID")
serviceAccountKey = []byte(os.Getenv("GOOGLE_SERVICE_ACCOUNT_KEY"))
The glue code combining the above two functions is straightforward.
func main() {
    ctx := context.Background()
    allIssues, err := getGitHubIssues(ctx)
    if err != nil {
       log.Fatalf("Unable to get GitHub issues: %v", err)
    }
    fmt.Printf("Total issues: %d\n", len(allIssues))

    err = updateSpreadsheet(len(allIssues))
    if err != nil {
       log.Fatalf("Unable to update spreadsheet: %v", err)
    }
}
We can manually run our script to gather the metrics and update the Google Sheets spreadsheet. However, we want to automate this process so that the metrics are always up to date and we have a consistent historical record.
Automating the metric-gathering process with GitHub Actions
GitHub Actions allows you to automate, customize, and execute your software development workflows in your GitHub repository. We will use GitHub Actions to run our script on a schedule and update the Google Sheets spreadsheet with the latest metrics.
Create a .github/workflows/update-spreadsheet.yml file in your repository with the following content:
name: Update spreadsheet with latest metrics

on:
  workflow_dispatch: # Manual
  schedule:
    - cron: '0 */12 * * *' # At 00:00 and 12:00 UTC

env:
  GITHUB_TOKEN: ${{ secrets.GITHUB_TOKEN }} # automatically generated
  GOOGLE_SERVICE_ACCOUNT_KEY: ${{ secrets.GOOGLE_SERVICE_ACCOUNT_KEY }}
  SPREADSHEET_ID: ${{ secrets.SPREADSHEET_ID }}

jobs:
  update-spreadsheet:
    runs-on: ubuntu-latest
    steps:
      - name: Checkout code
        uses: actions/checkout@11bd71901bbe5b1630ceea73d27597364c9af683 # v4.2.2
        with:
          fetch-depth: 0
      - name: Setup Go
        uses: actions/setup-go@3041bf56c941b39c61721a86cd11f3bb1338122a # v5.2.0
        with:
          go-version-file: 'go.mod'
      - name: Run
        run: go run main.go
The above GitHub Actions workflow runs the main.go script every 12 hours. GitHub automatically generates the
GITHUB_TOKEN secret. The GOOGLE_SERVICE_ACCOUNT_KEY and SPREADSHEET_ID secrets must be set up manually in the
repository settings.
The workflow checks out the code, sets up Go, and runs the script. After pushing the workflow file to GitHub, you can manually run the workflow to test it.
Display the metrics in Google Docs
To see the metrics in Google Docs or Google Slides, you can copy and paste the relevant cells from the Google Sheets spreadsheet. This operation will create a one-way link from Google Sheets to the document. You can refresh the data by clicking Tools > Linked objects > Update All.

Further reading
Free, flexible, and insightful: engineering metrics done right
Discover how to monitor and visualize your dev team’s performance with Grafana and an analytical database.Recently, we explained how to measure unreadable code and turn it into clean code, as well as how to make incremental improvements to your codebase with evolutionary architecture.
Previously, we showed how to reuse workflows and steps in GitHub Actions.
We also covered measuring the execution time of Go tests.
We also described inefficiencies in the GitHub code review process.
Code on GitHub
For the complete code, see the GitHub repository: github-metrics.
Watch
Note: If you want to comment on this article, please do so on the YouTube video.
