- Server CPU and memory utilization
- Server errors
- Server API latency (response time)
- Database slow queries
- Database performance metrics
What is software load testing?
Software load testing is a type of performance testing that simulates real-world user load on a software application. Load tests usually run in a test environment identical to the production environment.
The goals of load testing may include:
- Ensure the application meets the required performance criteria
- Ensure the application performance did not degrade after changes
- Test a new feature’s performance before releasing it to production
- Identify bottlenecks in the application to reduce compute costs and/or risks
- Run chaos engineering performance experiments
Load testing can be done manually or automatically. Many open-source and commercial tools are available to help you run load tests. Some features of load testing tools include:
- Record and replay user interactions, including simulating unique users
- Simulate different user loads
- Monitor the application’s performance during the test
- Generate reports with performance metrics
This article lists the key metrics you should gather during a software load test of your web application.
Server CPU and memory utilization
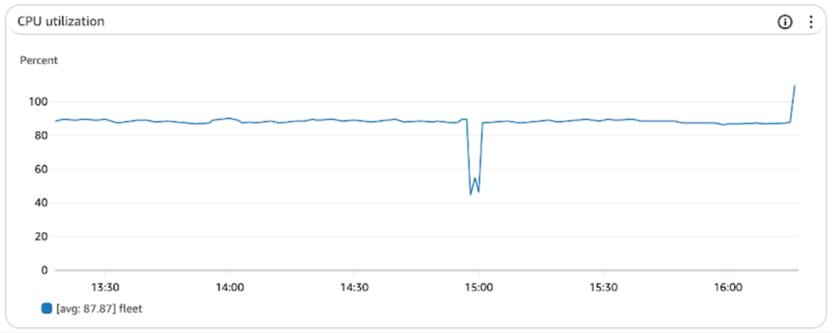
CPU utilization is the percentage of time the CPU is busy processing instructions, and memory utilization is the percentage of memory used by the server. Companies deploy multiple instances of the same application web server, and the load balancer distributes the user requests among them. These metrics are averages across all instances.
High CPU or memory utilization can indicate a bottleneck in the application or server. It may also signal that the application needs to be scaled horizontally (add more instances) or vertically (increase the server’s resources).
Low CPU or memory utilization may indicate that the application is over-provisioned, and infrastructure engineers could reduce resources to save costs.
Typical expectations for CPU and memory utilization are:
- CPU utilization should be below 80% on average
- Memory utilization should be below 80% on average

High CPU utilization during load test
Server errors
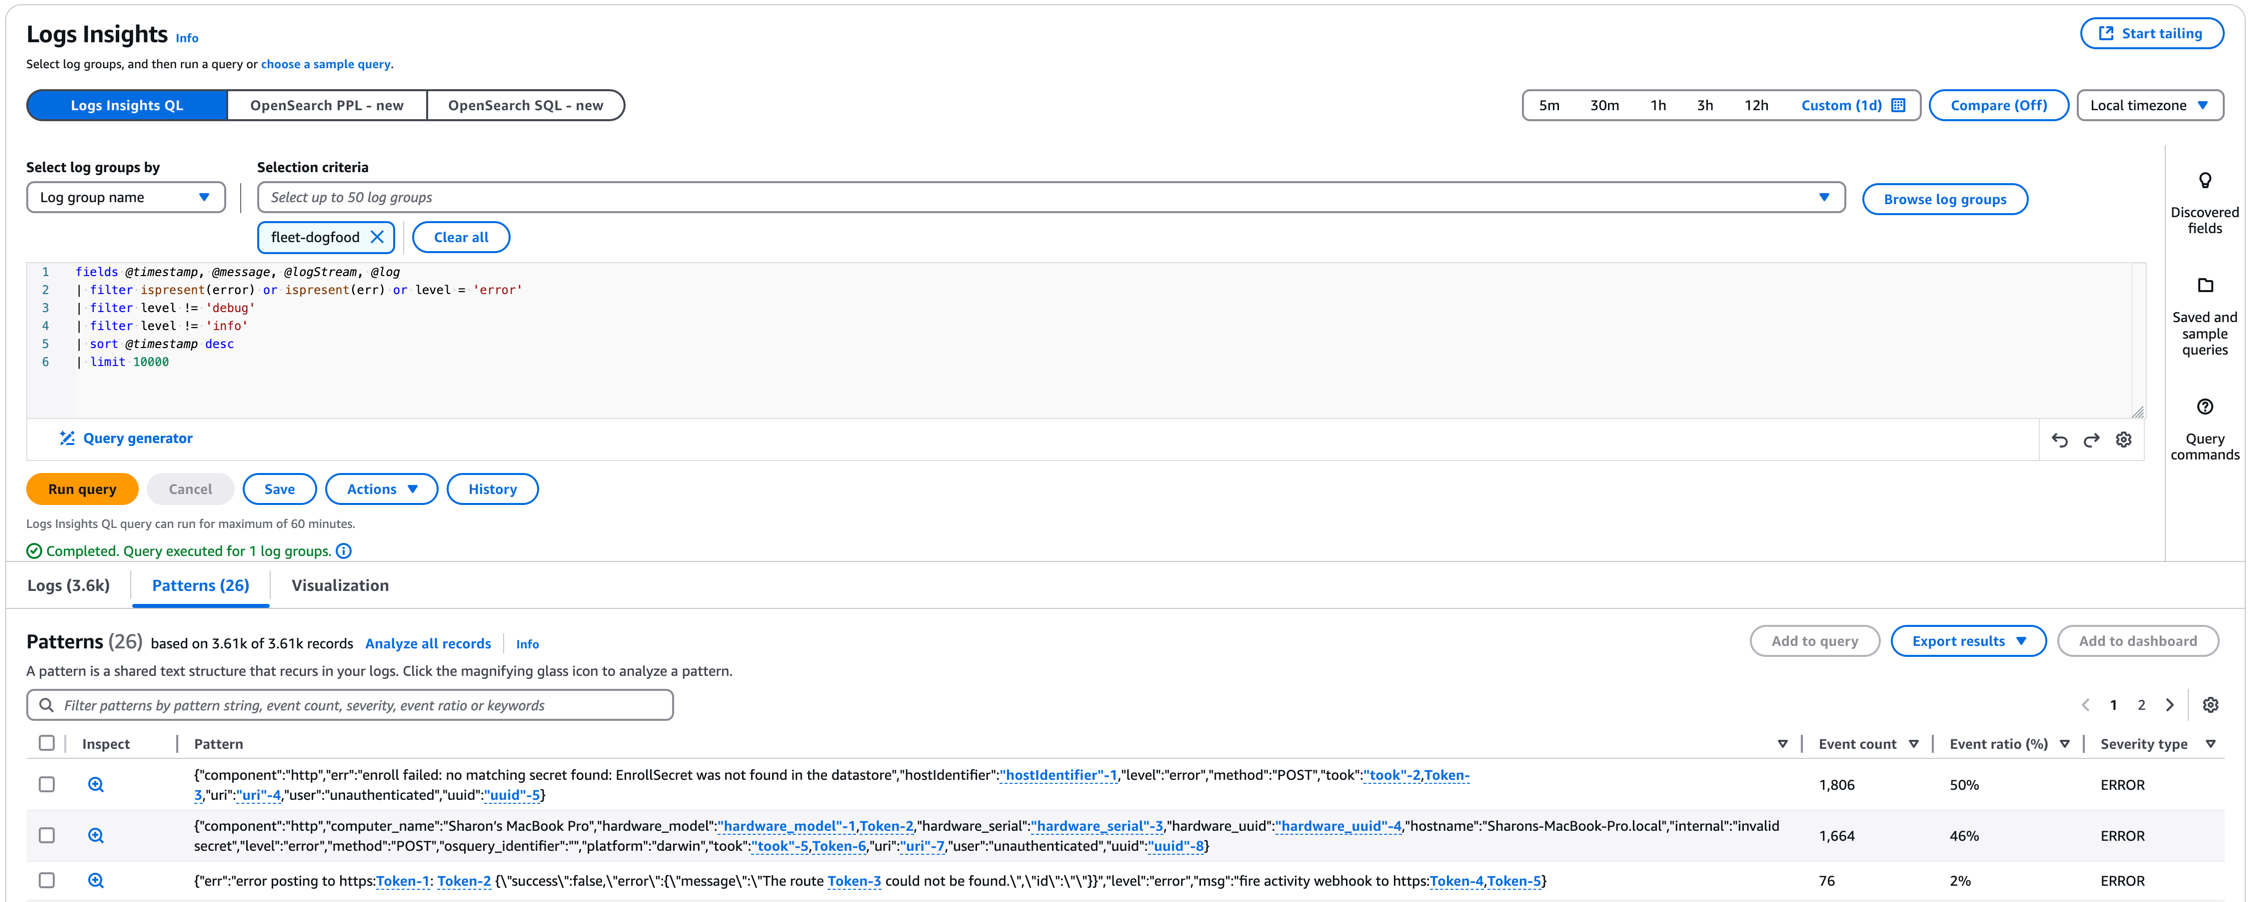
Server errors are error messages in the application logs or 5XX HTTP status codes. They can indicate that the application is not handling the load well, has a bug, or is misconfigured.
Error logs are a key debugging tool for developers. They can help identify the root cause of a functional or performance error and fix it. As such, developers must use error logs to report actual server errors and not just informational messages. For example, a 404 error is typically not a server error but a client error. A website user requesting a resource that does not exist is a common scenario. Client errors should be logged as informational messages or tagged appropriately to be excluded from the server error metric.

AWS Logs Insights JSON error filter and sample error patterns
The ideal number of server errors is zero. However, in practice, some errors are expected. For example, some startup or shutdown-related errors may occur if application servers are scaling up or down due to load. Note the expected errors in the test plan and adjust the error filter accordingly.
Server API latency (response time)
API latency is the time it takes for the server to respond to a request, measured in milliseconds. Typically, the business cares about user-facing API endpoints, such as the login, checkout, or search endpoints.
API latency is a critical metric for user experience. High latency can lead to user frustration and abandonment.
One standard metric is the 95th percentile latency. This metric indicates the latency that 95% of the requests are faster than. It is a good indicator of the user experience because it filters out outliers.

Example spike in latency during a load test experiment
Telemetry tools such as OpenTelemetry can help you gather API latency metrics and correlate them with other metrics, such as server errors or CPU utilization.
Database slow queries
Query response time is the time it takes for the database to respond to a query. Slow queries can indicate that the query is not optimized or that the table needs an index.
Slow queries can lead to high API latency and server errors. They can also lead to high CPU and memory utilization on the database server.
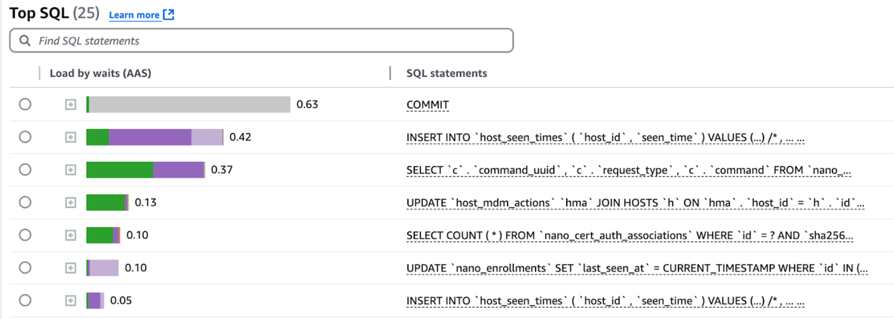
Typically, we want to look at the average query response time multiplied by the number of queries per second for each query signature. This will identify the queries that have the most impact on database performance.
The list of slow queries should remain stable during a load test. If it changes, it may indicate a new unoptimized query or a new bug in the application.

AWS RDS Performance Insights uses Average Active Sessions (AAS) as its slow query metric
Database performance metrics
Along with slow queries, we always gather the following database performance metrics:
Database CPU utilization
Just like the server, we monitor the database’s CPU utilization. The typical expectation is that CPU utilization should be below 80% on average.
Memory utilization may not be as critical for the database as for the server. We expect the database to use as much memory as possible to cache data and speed up queries.
Database threads running (sessions)
Database threads running is the number of database connections actively processing queries. High thread counts can indicate that the database is under heavy load.
The number of threads should be at or below the number of CPUs on the database server.
Database IO operations per second (IOPS)
Database IOPS is the number of disk read and write operations the database performs per second. High IOPS can indicate that the database is not effectively caching data or that too many writes are occurring.
IOPS should be in line with the database’s provisioned IOPS. If IOPS are consistently higher than provisioned, the database may need to be scaled up.
Additional metrics
The following metrics may also be necessary. However, these additional metrics may be more situational than the above top 5 metrics.
Network traffic
Network traffic includes the number of bytes sent and received by the server. Typically, the data received by the server is the user’s request, and the data sent by the server is the response.
However, in microservices architectures and servers with 3rd party integrations, our server may also make requests to other web servers.
User traffic is typically consistent from load test to load test. Traffic to other servers may change as engineers add new features. If the network traffic changes significantly, it may indicate a new bug in the application, such as application servers making too many requests to a 3rd party service.
Performance profile
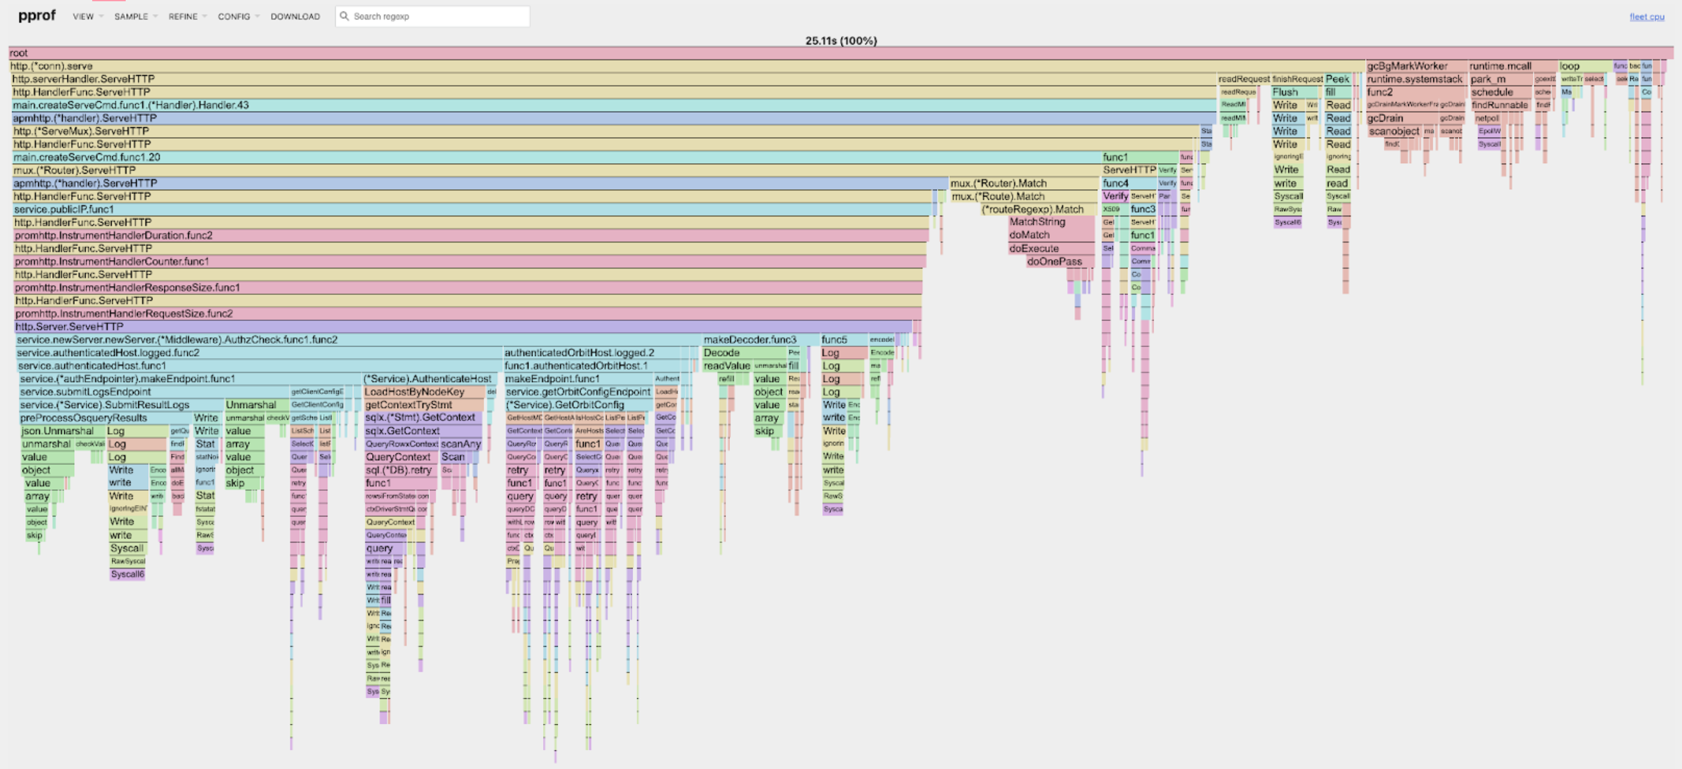
Many performance tools and modern programming languages can generate a performance profile. A performance profile is a breakdown of the time spent in each function of the application. It can help identify bottlenecks in the application code.
If code performance is a significant concern, take a performance profile during the load test and compare it to a baseline or the previous load test profile. If the profile changes significantly, it may indicate a new bug in the application or a new performance bottleneck.

Example performance profile from Go pprof
Database replication lag
If the database is replicated, the replication lag is the time it takes for changes to be sent from the primary database and applied to the replica database. High replication lag can indicate that the replica is not keeping up with the primary database.
High replication lag can lead to a bad user experience – for example, if the user saves data, then immediately retrieves it and receives stale data.
Further reading
OpenTelemetry: A developer’s best friend for production-ready code
See how developers can leverage OpenTelemetry during development to build better instrumented applications.Is OpenTelemetry useful for the average software developer?
Our initial exploration of OpenTelemetry’s practical value for everyday development tasks.How to benchmark performance of Go serializers
Measure and optimize your Go application’s performance with effective benchmarking techniques.
Watch us discuss the software load testing performance metrics
Note: If you want to comment on this article, please do so on the YouTube video.
