
We’ve changed our tune on OpenTelemetry.
In our previous article on OpenTelemetry with Jaeger, we were skeptical about its value for the average developer. The tooling seemed more suited for production monitoring than day-to-day development work. However, recent production issues have made us reconsider.
- Feature 1: API request and response bodies
- Feature 2: Database query instrumentation
- Feature 3: Outgoing HTTP requests
- Feature 4: Trace-log correlation
- Feature 5: Comprehensive error handling
The wake-up call
We discovered a critical gap in our production telemetry: several key API endpoints weren’t instrumented. When issues arose, we were flying blind. No traces. No visibility. Just frustrated customers and scrambling engineers.
This experience taught us an important lesson: telemetry isn’t just an operations concern, it’s a development concern. If developers don’t use and understand telemetry during development, we end up with half-baked instrumentation in production.
The solution? Developers must dogfood their own telemetry.
Setting up OpenTelemetry for development
Using OpenTelemetry during development provides immediate benefits:
- Complete instrumentation coverage before production
- Faster debugging with familiar tooling (same tooling in dev and production)
- Better understanding of code behavior
- Early detection of performance issues
We built a TODO application to demonstrate key OpenTelemetry features for developers. The examples use SigNoz as the backend, but any OpenTelemetry-compatible system works (Jaeger, Grafana, Datadog, etc.).
Note: In development, we often want more detailed telemetry than in production. Production may limit telemetry due to performance or security reasons. Many of the features we’ll demonstrate should have environment-specific toggles.
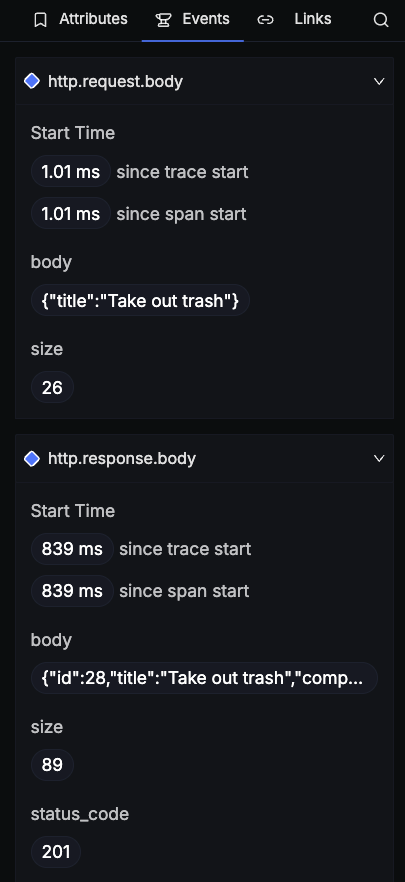
Feature 1: API request and response bodies
Seeing actual request and response bodies is invaluable during development. While you’d avoid this in production for security reasons, it’s essential for debugging locally.
Key OpenTelemetry concepts: attributes vs events
Attributes: Key-value pairs attached to spans that provide metadata. They’re indexed and searchable (e.g.,
http.method,http.status_code,user.id). Use attributes for the data you need to query or filter.Events: Timestamped records within a span that capture what happened at a specific moment. They’re perfect for logging request/response bodies, error messages, or any detailed information that doesn’t need to be searchable but provides context when debugging.
In our TODO app, we recorded request and response bodies as events:
span.AddEvent("http.request.body", trace.WithAttributes(
    attribute.String("body", requestBody),
))

span.AddEvent("http.response.body", trace.WithAttributes(
    attribute.String("body", responseBody),
))
This approach provides full API context without bloating searchable attributes.
Feature 2: Database query instrumentation
Database queries often cause performance bottlenecks. OpenTelemetry captures both query timing and the actual SQL executed.
Standard instrumentation shows parameterized queries:
SELECT * FROM todos WHERE user_id = ? AND status = ?
For debugging, we need the actual values. Our enhanced instrumentation includes both:
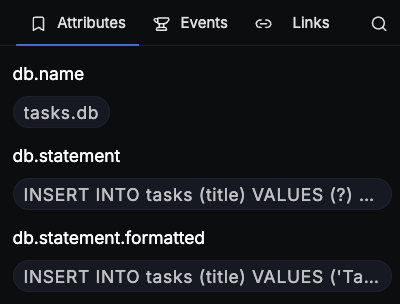
span.SetAttributes(
    attribute.String("db.statement", "SELECT * FROM todos WHERE user_id = ? AND status = ?"),
    attribute.String("db.statement.formatted", "SELECT * FROM todos WHERE user_id = 123 AND status = 'active'"),
)
This dual approach maintains security (prepared statements against SQL injection) while providing debugging context. Use populated queries to:
- Reproduce issues by running the exact query
- Understand why a query returned unexpected results
- Debug complex queries with multiple parameters
Alternatively, you could log the populated query statements instead of adding them as span attributes. Putting them in the logs gives you more flexibility in controlling data retention policies, as logs and traces often have different storage durations and access controls in production environments.
Feature 3: Outgoing HTTP requests
Modern applications integrate with external APIs and microservices. Outgoing HTTP calls need the same visibility as incoming requests.
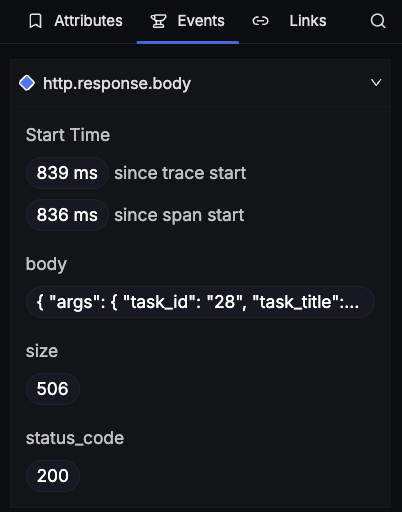
Our TODO app instruments outgoing HTTP requests, capturing:
// Before making the request
span.AddEvent("http.request.body", trace.WithAttributes(
    attribute.String("body", requestBody),
    attribute.Int("size", len(requestBody)),
))

// After receiving the response
span.AddEvent("http.response.body", trace.WithAttributes(
    attribute.String("body", responseBody),
    attribute.Int("size", len(responseBody)),
    attribute.Int("status_code", resp.StatusCode),
))
This visibility is crucial when:
- Third-party APIs return unexpected results
- You need to debug authentication or request formatting issues
- Performance bottlenecks come from external dependencies
- You’re troubleshooting integration problems
External calls receive the same instrumentation as internal operations, eliminating black boxes during development.
Feature 4: Trace-log correlation
OpenTelemetry connects traces with logs, enabling seamless navigation between high-level trace data and detailed log output.

Key OpenTelemetry concepts: spans vs traces
Span: A single unit of work within a trace. It represents an operation like a database query, HTTP request, or function call. Each span has a unique
span_idand may have aparent_span_idto form a tree. Spans are connected through these relationships to reflect the call hierarchy.Trace: The complete journey of a request through your system, composed of multiple spans that all share the same
trace_id. The root span has no parent and marks the start of the trace. Think of a trace as the tree, and spans as the branches and leaves.
In our TODO app, we inject trace context into all log entries:
logger := log.With(
    "trace_id", span.SpanContext().TraceID().String(),
    "span_id", span.SpanContext().SpanID().String(),
)

logger.Info("Creating new TODO item", "user_id", userID, "title", todo.Title)
This correlation enables:
- Quick navigation from a slow span to its detailed logs
- Understanding the sequence of operations within a request
- Debugging complex flows across multiple services
- Maintaining context when troubleshooting issues
Viewing traces and logs together reduces debugging time significantly.
Feature 5: Comprehensive error handling
OpenTelemetry captures complete error context and propagation paths throughout your system.
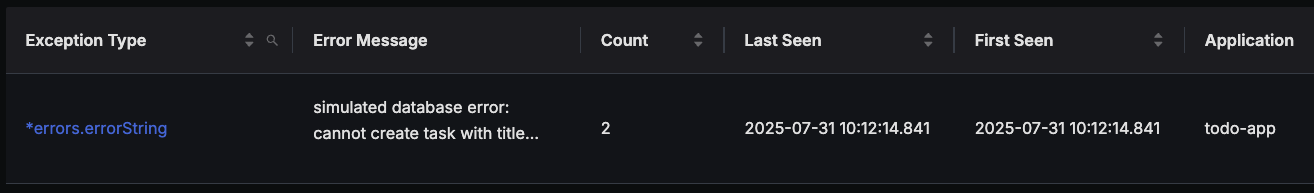
Error counts may appear inflated because they’re counted at each span level:
- Database layer throws an error (count: 1)
- Service layer catches and returns error response (count: 2)
This propagation helps identify error origins and their path through application layers.
Example error instrumentation:
// Simple error recording
span.RecordError(err)
span.SetStatus(codes.Error, err.Error())

// With stack trace
span.RecordError(err, trace.WithStackTrace(true))
With proper error instrumentation, you get:
- Complete stack traces for debugging
- Error propagation paths through your system
- Direct links to the failing trace
- Associated logs with full context
- Performance impact of error handling
All debugging information exists in one place, reducing troubleshooting from hours to minutes.
Moving forward
Our next step is implementing this approach in our production application. The benefits are clear:
- Complete visibility: No more blind spots in our API endpoints
- Faster debugging: All context in one place
- Better habits: Developers who use telemetry build better instrumented code
- Proactive monitoring: Issues are caught before they impact users
Telemetry isn’t an afterthought. It’s a development tool that we can use from day one.
Try it yourself
See these concepts in action with our instrumented TODO application on GitHub. The AI-generated code has readability issues, but effectively demonstrates all telemetry concepts.
To get started with your own setup:
- Install SigNoz using Docker
- Clone the TODO app repository
- Run the app with OpenTelemetry enabled
- Start exploring your traces!
The goal isn’t perfect code. It’s perfect visibility into code behavior.
Further reading
Top 5 metrics for software load testing performance
Learn which telemetry metrics matter most when load testing your applications.How to benchmark performance of Go serializers
Discover performance optimization techniques using Go’s built-in profiling tools.Is OpenTelemetry useful for the average software developer?
Our initial skeptical take on OpenTelemetry and its challenges for development use.
Note: What’s your experience with OpenTelemetry? Have you found other creative ways to use telemetry during development?
Watch us demonstrate OpenTelemetry features useful for developers
Note: If you want to comment on this article, please do so on the YouTube video.