
Tracking engineering metrics doesn’t have to mean signing up for another expensive SaaS tool. This guide will show you how to build a flexible, powerful, and completely free metrics dashboard using open-source tools like Grafana and a fast analytical database. Whether you’re monitoring cycle time, bug fix velocity, or pull request activity, this setup gives you deep visibility that your team will actually want to look at.
In our previous engineering metrics guide, we showed a basic way to track metrics using GitHub Actions and the Google Sheets API. The data in Google Sheets can be visualized using a tool like Google’s Looker Studio. However, we wanted more powerful visualizations that could be dynamically sliced, diced, and drilled down into. Also, we wanted the tools to be free so we wouldn’t need to justify the costs to our management.
The free engineering benchmarks stack
As in our previous example, we used GitHub Actions to schedule our metrics collection and compute the data we wanted to track.
For visualizations, we decided on Grafana. Grafana is a leader in visualizing data, is open source, and can be self-hosted. We used Grafana’s free cloud tier for this example since we didn’t want to spin up any infrastructure ourselves.

However, the problem with Grafana Cloud’s free tier is that data is retained for only 14 days. We wanted to keep and compare our engineering metrics year over year. Due to its generous free tier, we decided to use Google’s BigQuery analytics database.
- Storage: The first 10 GiB per month is free.
- Queries: The first 1 TiB of query data processed per month is free.
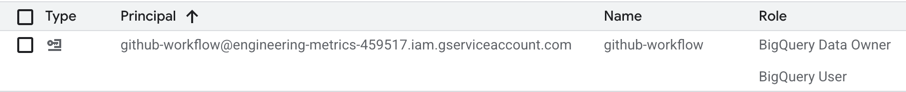
We created a project in Google Cloud Console, created a dataset (github_metrics), made a service account with BigQuery roles, and created a JWT key for the service account to use with our app.
Note: BigQuery has a sandbox mode that does not require a credit card. However, it has some API limitations. We recommend enabling billing on the account and monitoring your usage to ensure you stay within the free limits.
Picking the metric to track: pickup time
There are many engineering benchmark metrics we could have started with, but we decided to start with one that we’ve been keenly aware of at many points in our development life. When developers finish implementing and testing their feature and put it up for review, sometimes the PR sits there for days at a time. This waiting time is a frustrating experience for developers, especially if they or others depend on those changes to make progress in their work. This time to review has a direct impact on engineering velocity.
We define pickup time as the time from when the PR is marked as ready for review until the code review is done. The reviewer does not need to approve the change; they can also reject or simply comment on it. We are measuring the time from when the developer finishes their work until they get feedback on their work.
Implementing metrics gathering
Since we knew our code would run in a GitHub Actions workflow, we implemented it as a reusable GitHub action. We decided to use JavaScript (not TypeScript) to simplify the action.
We used the octokit.js GitHub API client to fetch the pull requests from our repo, extract the timeline events and review events from the PRs, and calculate the pickup time.
In our initial review of the data, we noticed occasional spikes in pickup time on Mondays. That’s because pull requests created on Friday were sitting around over the weekend until being reviewed on Monday. Since we don’t expect our software developers to work weekends, we removed weekends from our calculations. Removing weekends was one of the most time-consuming implementation details. We created a unit test to make sure we got the details right.
We added a --print-only option to our program to manually examine the data before we uploaded it to the analytical
database.
To interface with BigQuery, we used Google’s BigQuery Node.js client. Our table schema was:
fields: [
  { name: 'review_date', type: 'DATE', mode: 'REQUIRED' },
  { name: 'pr_creator', type: 'STRING', mode: 'REQUIRED' },
  { name: 'pr_url', type: 'STRING', mode: 'REQUIRED' },
  { name: 'pickup_time_seconds', type: 'INTEGER', mode: 'REQUIRED' },
  { name: 'repository', type: 'STRING', mode: 'REQUIRED' },
  { name: 'pr_number', type: 'INTEGER', mode: 'REQUIRED' },
  { name: 'target_branch', type: 'STRING', mode: 'REQUIRED' },
  { name: 'ready_time', type: 'TIMESTAMP', mode: 'REQUIRED' },
  { name: 'first_review_time', type: 'TIMESTAMP', mode: 'REQUIRED' }
]
The pr_number was the primary key. Once we calculate and save the pickup time for a PR, we do not update it on future
runs.
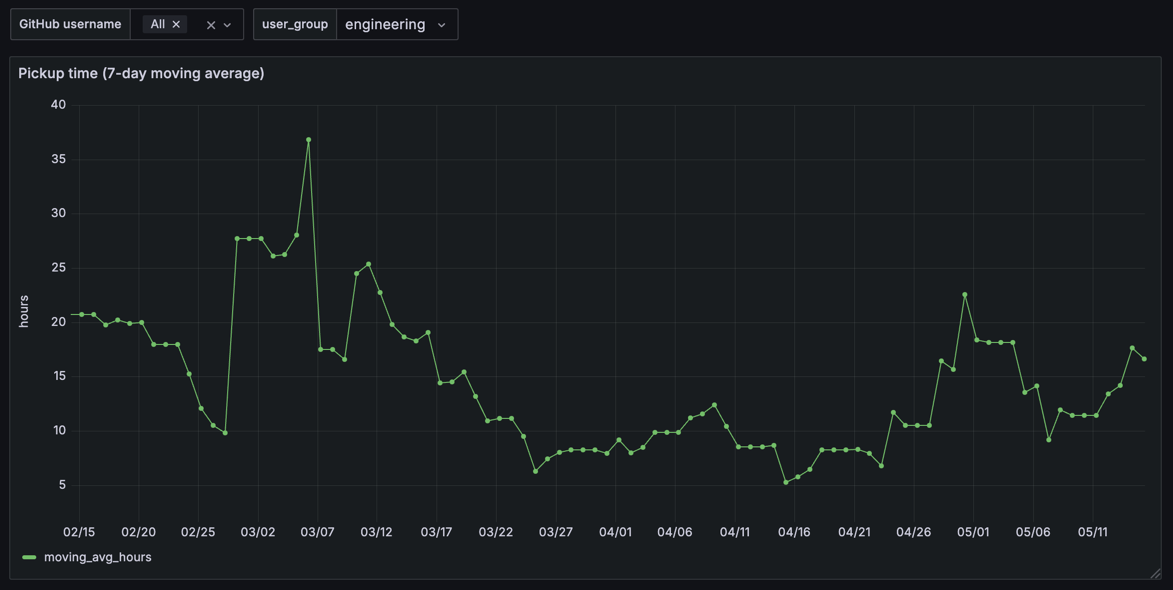
Creating Grafana chart
In Grafana, we created a data source connected to our BigQuery database. Then, we created a new dashboard with a new pickup time chart. We had to decide how to visualize the data. We decided on:
- 7-day moving average
- filter by time range
- filter by GitHub username
- filter by user group (e.g., engineering)
- include the PR numbers for each data point for drill down
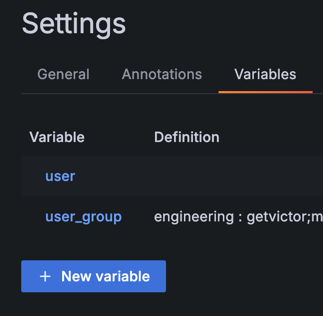
We created Grafana variables to filter by username/group.
Creating the correct SQL query that gathered all the data and integrated with Grafana’s features took considerable time. Below is the query we came up with:
WITH daily AS (
  SELECT
    DATE(first_review_time, "America/Chicago") AS day,
    COUNT(*) AS pr_count,
    SUM(pickup_time_seconds) AS total_seconds
  FROM
    `engineering-metrics-123456.github_metrics.pr_pickup_time`
  WHERE
    first_review_time BETWEEN TIMESTAMP_SUB(TIMESTAMP_MILLIS($__from), INTERVAL 6 DAY)
    AND TIMESTAMP_MILLIS($__to)
    AND (
        -- No filters selected: show all
      (
        ('${user:csv}' = '' OR '${user:csv}' = '__all')
        AND ('${user_group:csv}' = '' OR '${user_group:csv}' = '__all')
      )
      OR (
        -- Only user filter applied
        ('${user:csv}' != '__all' AND '${user:csv}' != '')
        AND ('${user_group:csv}' = '' OR '${user_group:csv}' = '__all')
        AND pr_creator IN UNNEST(SPLIT('${user:csv}', ','))
      )
      OR (
        -- Only user_group filter applied
        ('${user_group:csv}' != '__all' AND '${user_group:csv}' != '')
        AND ('${user:csv}' = '' OR '${user:csv}' = '__all')
        AND pr_creator IN UNNEST(SPLIT('${user_group:csv}', ';'))
      )
      OR (
        -- Both filters applied → take intersection
        ('${user:csv}' != '__all' AND '${user:csv}' != '')
        AND ('${user_group:csv}' != '__all' AND '${user_group:csv}' != '')
        AND pr_creator IN (
          SELECT val FROM UNNEST(SPLIT('${user:csv}', ',')) val
          INTERSECT DISTINCT
          SELECT val FROM UNNEST(SPLIT('${user_group:csv}', ';')) val
        )
      )
    )
  GROUP BY
    day
),
calendar AS (
  -- Build list of days in the visible Grafana range
  SELECT
    day
  FROM
    UNNEST(
      GENERATE_DATE_ARRAY(
        DATE(TIMESTAMP_MILLIS($__from)),
        DATE(TIMESTAMP_MILLIS($__to))
      )
    ) AS day
),
rolling_avg AS (
  SELECT
    c.day,
    TIMESTAMP(CONCAT(CAST(c.day AS STRING), ' 12:00:00')) AS time,
    -- True 7-day weighted average
    (
      SELECT
        SUM(d.total_seconds)
      FROM
        daily d
      WHERE
        d.day BETWEEN DATE_SUB(c.day, INTERVAL 6 DAY)
        AND c.day
    ) / (
      SELECT
        SUM(d.pr_count)
      FROM
        daily d
      WHERE
        d.day BETWEEN DATE_SUB(c.day, INTERVAL 6 DAY)
        AND c.day
    ) / 3600 AS moving_avg_hours
  FROM
    calendar c
)
SELECT
  r.time,
  r.moving_avg_hours,
  (
    -- Optional: attach PR numbers per window
    SELECT
      ARRAY_AGG(DISTINCT pr_number)
    FROM
      `engineering-metrics-459517.github_metrics.pr_pickup_time` p
    WHERE
      DATE(p.first_review_time, "America/Chicago") BETWEEN DATE(DATE_SUB(r.time, INTERVAL 6 DAY))
      AND DATE(r.time)
      AND (
          -- No filters selected: show all
        (
          ('${user:csv}' = '' OR '${user:csv}' = '__all')
          AND ('${user_group:csv}' = '' OR '${user_group:csv}' = '__all')
        )
        OR (
          -- Only user filter applied
          ('${user:csv}' != '__all' AND '${user:csv}' != '')
          AND ('${user_group:csv}' = '' OR '${user_group:csv}' = '__all')
          AND pr_creator IN UNNEST(SPLIT('${user:csv}', ','))
        )
        OR (
          -- Only user_group filter applied
          ('${user_group:csv}' != '__all' AND '${user_group:csv}' != '')
          AND ('${user:csv}' = '' OR '${user:csv}' = '__all')
          AND pr_creator IN UNNEST(SPLIT('${user_group:csv}', ';'))
        )
        OR (
          -- Both filters applied → take intersection
          ('${user:csv}' != '__all' AND '${user:csv}' != '')
          AND ('${user_group:csv}' != '__all' AND '${user_group:csv}' != '')
          AND pr_creator IN (
            SELECT val FROM UNNEST(SPLIT('${user:csv}', ',')) val
            INTERSECT DISTINCT
            SELECT val FROM UNNEST(SPLIT('${user_group:csv}', ';')) val
          )
        )
      )
  ) AS pr_numbers_window
FROM
  rolling_avg r
ORDER BY
  r.time
In the above query, we used Grafana-specific variables such as $__from, $__to, ${user:csv}, etc.
We also had to deal with the timestamp shift problem, where the chart data was off by 1 day, since we were stripping the
time from first_review_time but displaying the data in local time (the day before UTC midnight). This statement
attempts to fix the problem by changing the time to noon: TIMESTAMP(CONCAT(CAST(c.day AS STRING), '12:00:00')) AS time
The final chart looked like this:
We can inspect the data to drill down into the PR numbers for each data point:
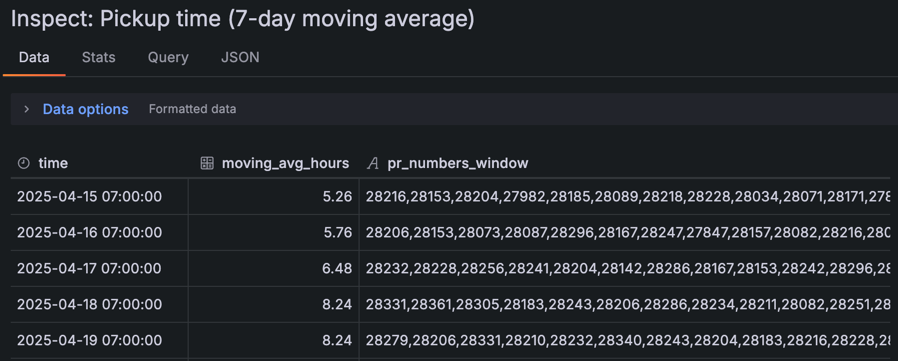
With the PR numbers, we can explore our data using the following query:
-- Sample query to dig into the details. Replace the PR numbers list.
SELECT * FROM `engineering-metrics-123456.github_metrics.pr_pickup_time`
WHERE pr_number IN (28625,28570,28417,28658,28382,28538,28608)
ORDER BY pickup_time_seconds DESC
Creating the GitHub Actions workflow
Once everything worked, we set up a GitHub workflow to run daily and automatically update the metrics.
name: Collect PR Pickup Time Metrics

on:
  schedule:
    - cron: '0 9 * * *'  # Run at 4am CDT (9am UTC)
  workflow_dispatch:      # Allow manual triggering

jobs:
  collect-metrics:
    runs-on: ubuntu-latest
    steps:
      - name: Checkout code
        uses: actions/checkout@v4

      - name: Set up Node.js
        uses: actions/setup-node@v4
        with:
          node-version: '16'
          cache: 'npm'

      - name: Install dependencies
        run: npm ci

      - name: Create service account key file
        run: |
          echo '${{ secrets.GCP_SERVICE_ACCOUNT_KEY }}' > service-account-key.json
          # Verify the file is valid JSON
          cat service-account-key.json | jq . > /dev/null

      - name: Collect and upload metrics
        uses: ./
        with:
          github-token: ${{ secrets.GITHUB_TOKEN }}
          config-path: './config.json'
          bigquery-project: ${{ secrets.BIGQUERY_PROJECT_ID }}
          bigquery-dataset: 'github_metrics'
          bigquery-table: 'pr_pickup_time'
          target-branch: 'main'
          lookback-days: '30'
          print-only: 'false'
        env:
          GITHUB_TOKEN: ${{ secrets.GITHUB_TOKEN }}
          BIGQUERY_PROJECT_ID: ${{ secrets.BIGQUERY_PROJECT_ID }}
          SERVICE_ACCOUNT_KEY_PATH: './service-account-key.json'
Code on GitHub
Our code is available on GitHub at: https://github.com/getvictor/pickup-time
Further reading
Why transparency beats everything else in engineering
How visibility into priorities and work creates accountability and transforms engineering culture.How to spot and reduce code complexity
A practical guide to the most useful metrics for understanding and improving code structure and maintainability.Turning messy code into clean, readable systems
Why code readability matters—and how to measure and improve it for long-term productivity.
Watch how to set up free engineering metrics
Note: If you want to comment on this article, please do so on the YouTube video.