
Go is designed for fast compilation. However, sometimes, you notice that your builds have gotten slower or that certain code changes cause an unexpectedly long recompile time. In this article, we show how to analyze your compilation times and take steps to improve them.
Turn on the Go build cache
First, you must know that Go is very good at caching build artifacts. If you make a small change and rerun the build, the rerun will be significantly faster because Go will reuse the cached artifacts from the previous build. However, if you update the Go version, change the build flags, or pull in new or different dependencies, Go may rebuild everything from scratch.
The first step in improving your build time is to make sure you are using a build cache. The cache is enabled by default
on your development machine, but that may not be true on your CI/CD system. Ensure you use a build cache across multiple
CI/CD runs. For example, the GitHub Actions
setup-go action has caching turned on by default.
Analyze a Go build
We can clear the build cache with the following:
go clean -cache
Now, we can run a clean build with the -debug-trace flag:
time go build -debug-trace=debug-trace.json ./cmd/fleet
We use the time command to measure the time the build takes. It is good practice to always use the time command when
measuring performance. The time command is built into our Z shell (zsh), but a similar command is available in other
shells and OSes.
In the time output, we see how long our build took:
79.25s user 20.13s system 518% cpu 19.183 total
The total time (19.183s) is the wall clock time we waited for the build to finish. The user and system times are spent executing user and system code. They are larger than the wall clock time because we use a multi-core machine.
The debug trace is in Trace Event Format and looks like this:
[
{"name":"Running build command","ph":"B","ts":1739801608027038,"pid":0,"tid":0}
,{"name":"load.PackagesAndErrors","ph":"B","ts":1739801608027222,"pid":0,"tid":0}
,{"name":"modfetch.download github.com/WatchBeam/clock@v0.0.0-20170901150240-b08e6b4da7ea","ph":"B","ts":1739801608038996,"pid":0,"tid":0}
,{"name":"modfetch.download github.com/WatchBeam/clock@v0.0.0-20170901150240-b08e6b4da7ea","ph":"E","ts":1739801608039035,"pid":0,"tid":0}
,{"name":"modfetch.download github.com/briandowns/spinner@v1.23.1","ph":"B","ts":1739801608039382,"pid":0,"tid":0}
,{"name":"modfetch.download github.com/briandowns/spinner@v1.23.1","ph":"E","ts":1739801608039410,"pid":0,"tid":0}
,{"name":"modfetch.download github.com/e-dard/netbug@v0.0.0-20151029172837-e64d308a0b20","ph":"B","ts":1739801608039643,"pid":0,"tid":0}
,{"name":"modfetch.download github.com/e-dard/netbug@v0.0.0-20151029172837-e64d308a0b20","ph":"E","ts":1739801608039808,"pid":0,"tid":0}
,{"name":"modfetch.download github.com/getsentry/sentry-go@v0.18.0","ph":"B","ts":1739801608053496,"pid":0,"tid":0}
... and so on
A widespread tool for visualizing Trace Event Format is Perfetto. Click Open trace file
and upload your trace. Use Ctrl + Scroll to zoom in and out and Shift + Scroll to move right or left. The WASD
keyboard keys also work.
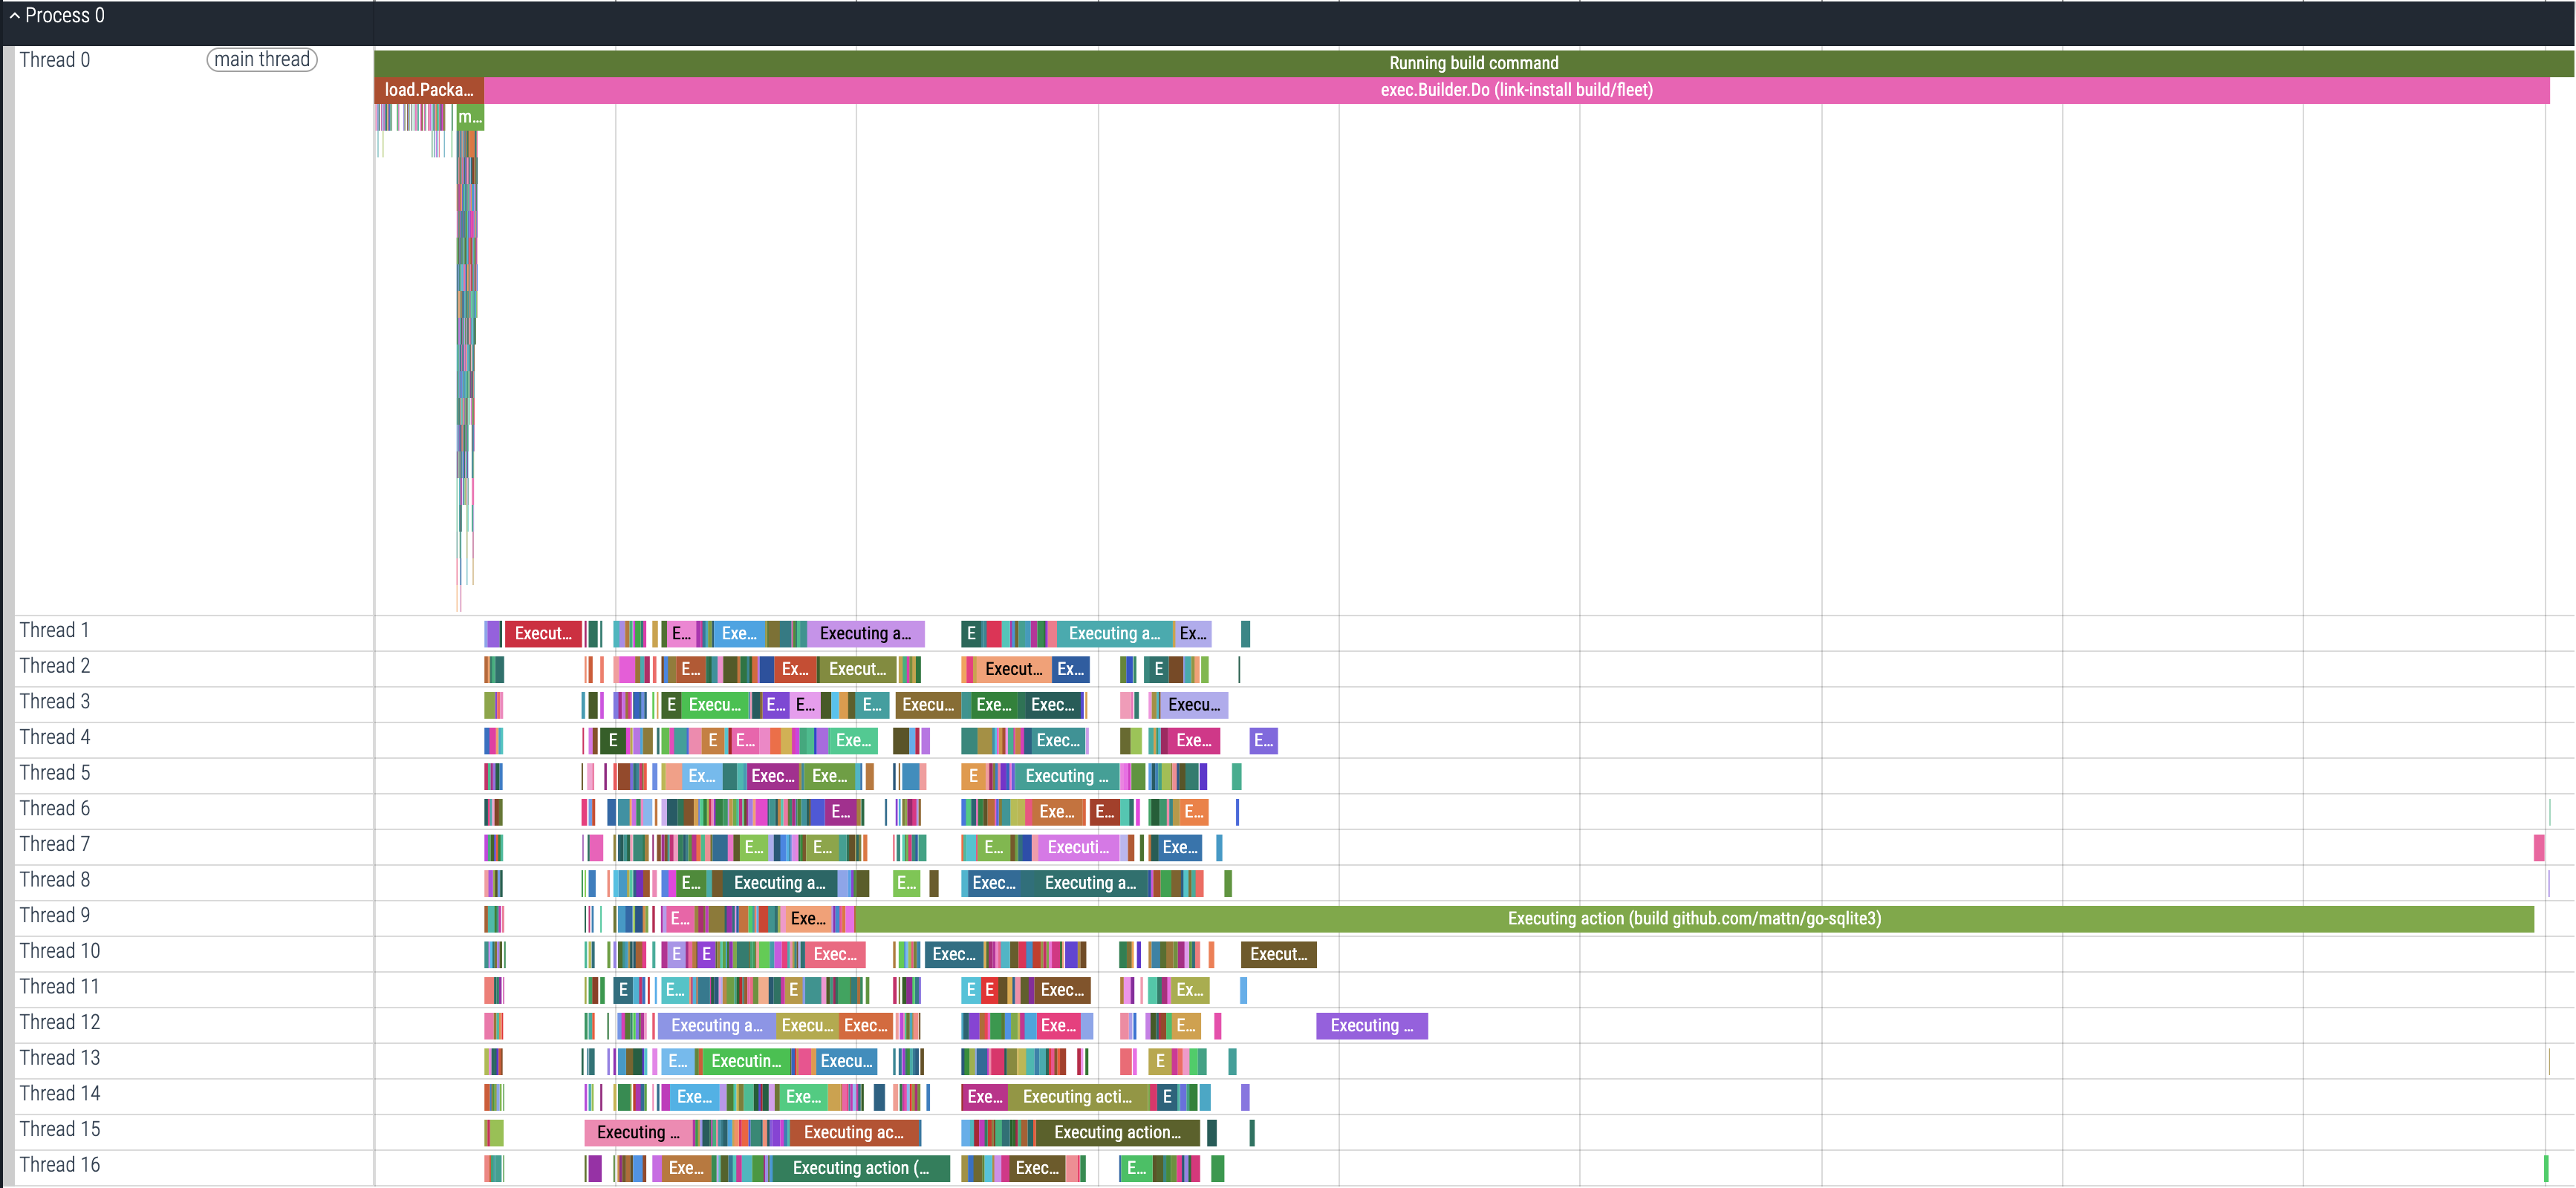
The Perfetto tool showing a Go build debug trace
The trace shows that our https://github.com/mattn/go-sqlite3 dependency is taking most of the build time. The fact that we have 16 cores doesn’t help because Go is not parallelizing the build for this dependency. This dependency uses CGO, so the build takes time to compile C files.
We attempted to speed up the build by adding the go-sqlite3 dependency to our top ./cmd/fleet package, assuming the
build tool would start compiling it first. However, the total build took longer because the subsequent link step became
much slower.
As we mentioned above, the initial compile time is usually not a big concern if you are using a build cache. So, let’s try making a small change and analyzing the recompile time. We make a change to a frequently modified package.
echo 'var _ = "bozo"' >> ./server/datastore/mysql/mysql.go
time go build -debug-trace=debug-trace-recompile.json ./cmd/fleet
The total recompile time is 1.229s, and the trace looks like this:
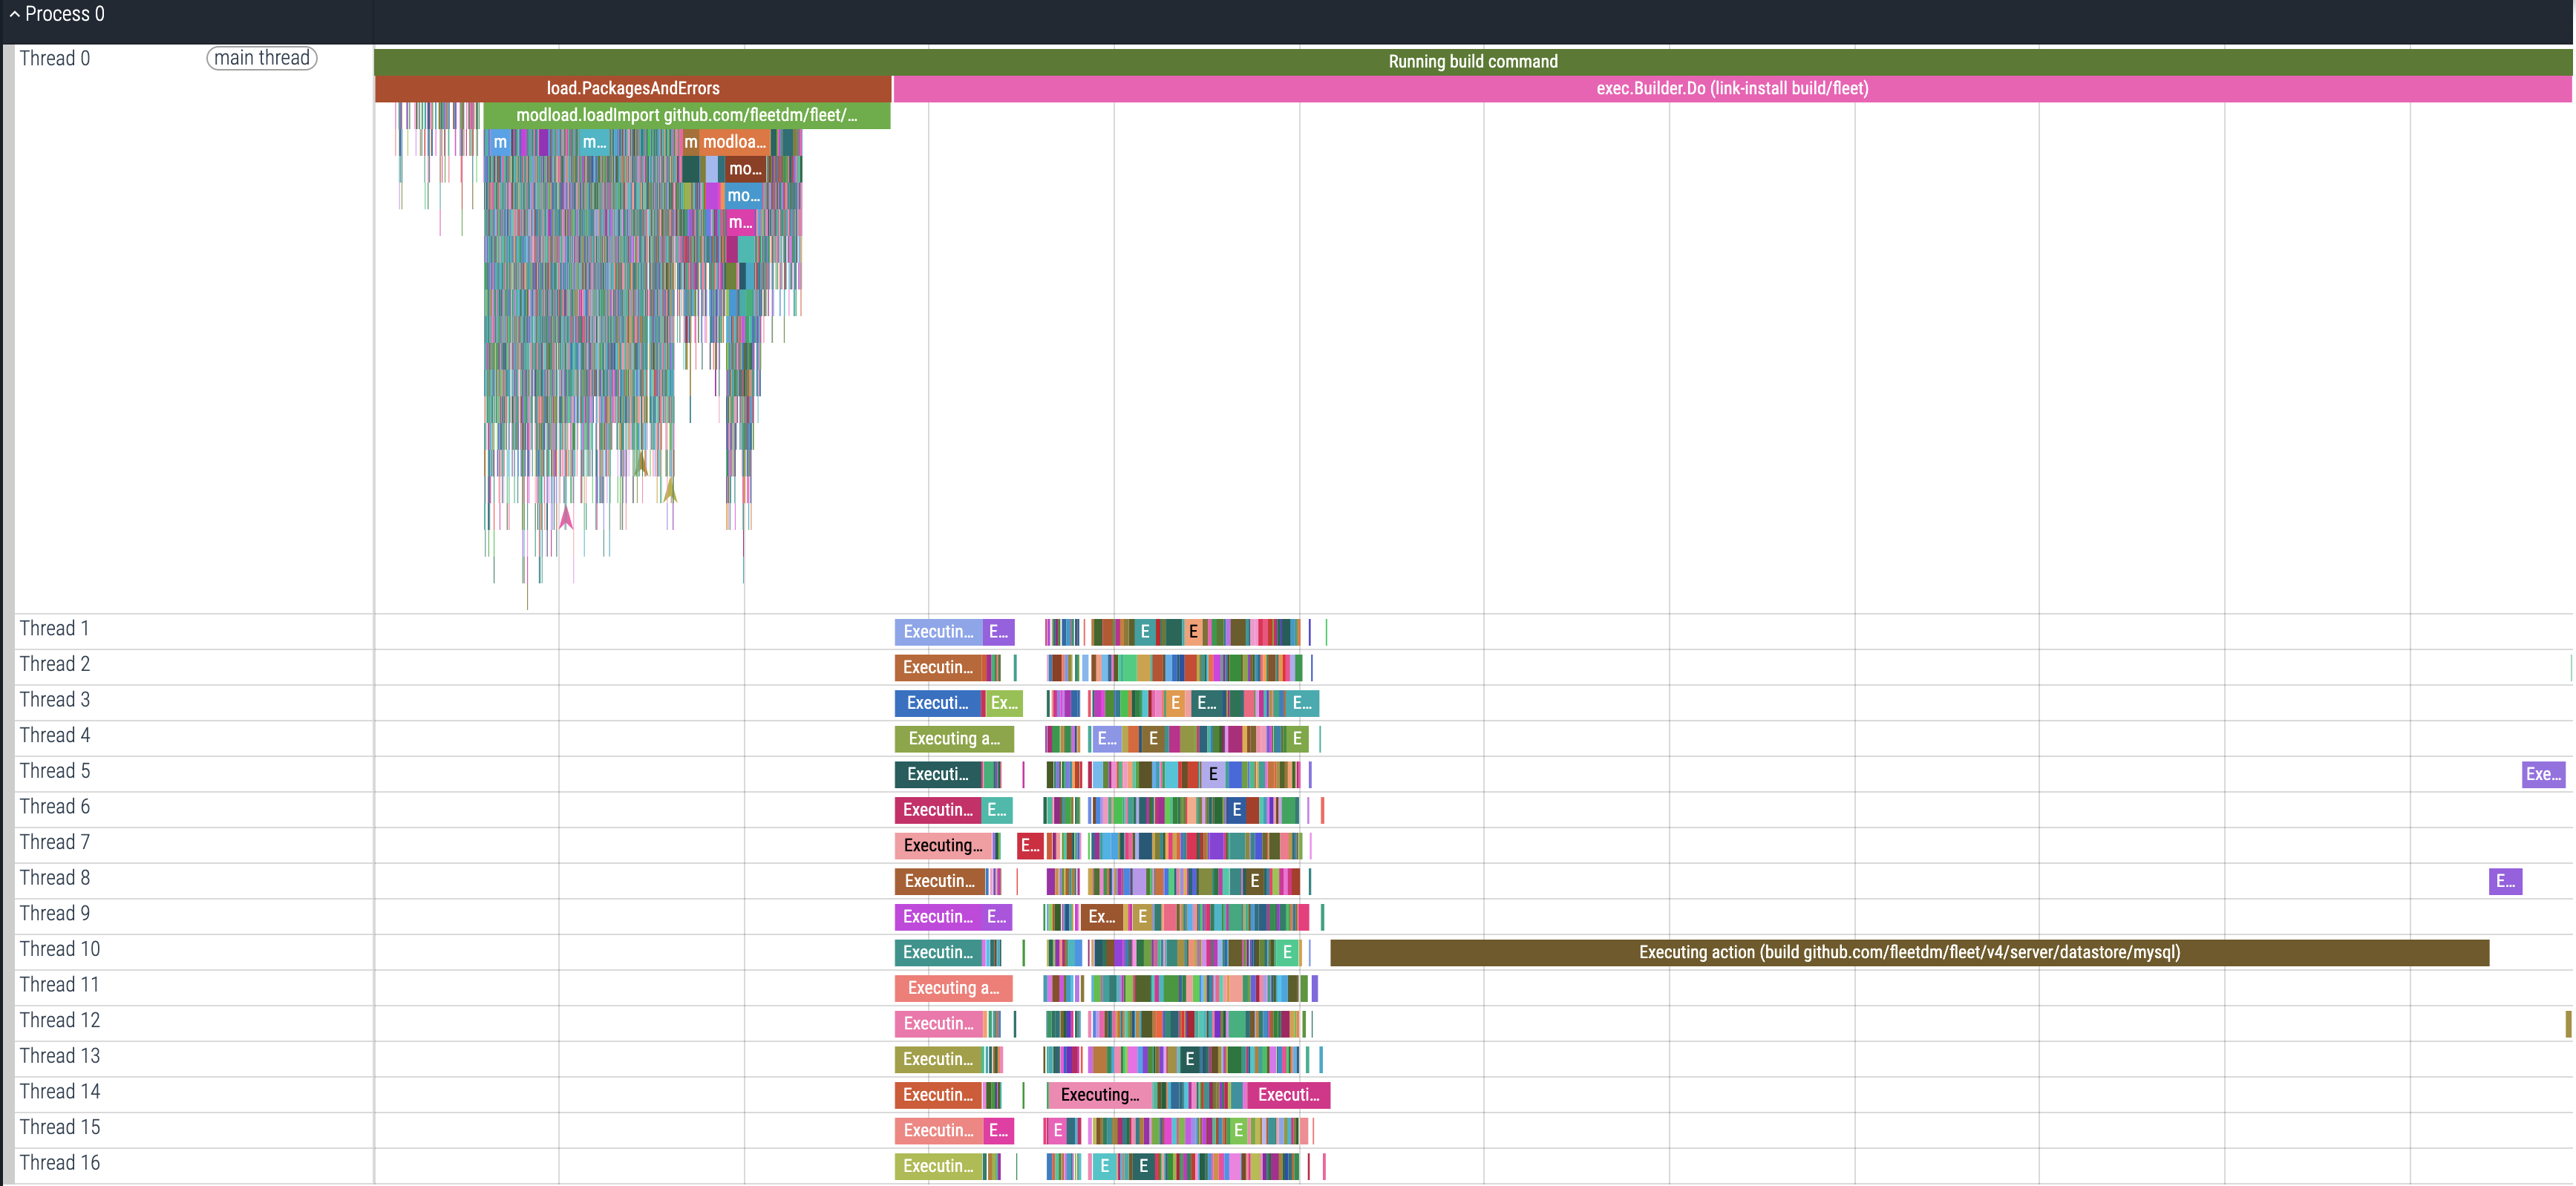
The Perfetto tool showing a Go recompile debug trace
We see that the mysql package we modified is taking about half the recompile time. The load.PackagesAndErrors step
takes ~300ms and is not parallelized. This step is part of the Go toolchain. Modifying a smaller package would reduce
the recompile time. If you have a large package that is frequently modified, you can improve the build time by splitting
it into smaller packages.
Find why dependencies are included in the build
In a previous article, we described how to find Go package dependencies. A way to analyze
the build and see why a dependency is being pulled in is to use the -debug-actiongraph flag:
go clean -cache
time go build -debug-actiongraph=actiongraph.json ./cmd/fleet
The resulting actiongraph.json is a JSON file containing an array of entries such as:
{
    "ID": 27,
    "Mode": "build",
    "Package": "github.com/fleetdm/fleet/v4/server/datastore/filesystem",
    "Deps": [
        4,
        11,
        23,
        33,
        93,
        97,
        180,
        103
    ],
    "Objdir": "/var/folders/r6/br06kz3s6lxb_75zz6dkjvvc0000gn/T/go-build3105381437/b845/",
    "Priority": 843,
    "NeedBuild": true,
    "ActionID": "JGOAJdypDJJbwlHvaUPE",
    "BuildID": "JGOAJdypDJJbwlHvaUPE/B47ZHL3FCDKdll6TubU2",
    "TimeReady": "2025-02-18T09:02:54.257806-06:00",
    "TimeStart": "2025-02-18T09:02:54.272756-06:00",
    "TimeDone": "2025-02-18T09:02:54.293356-06:00",
    "Cmd": [
        "/opt/homebrew/Cellar/go/1.23.4/libexec/pkg/tool/darwin_arm64/compile -o /var/folders/r6/br06kz3s6lxb_75zz6dkjvvc0000gn/T/go-build3105381437/b845/_pkg_.a -trimpath \"/var/folders/r6/br06kz3s6lxb_75zz6dkjvvc0000gn/T/go-build3105381437/b845=\u003e\" -p github.com/fleetdm/fleet/v4/server/datastore/filesystem -lang=go1.23 -complete -buildid JGOAJdypDJJbwlHvaUPE/JGOAJdypDJJbwlHvaUPE -goversion go1.23.4 -c=4 -shared -nolocalimports -importcfg /var/folders/r6/br06kz3s6lxb_75zz6dkjvvc0000gn/T/go-build3105381437/b845/importcfg -pack /Users/victor/work/fleet/server/datastore/filesystem/software_installer.go"
    ],
    "CmdReal": 17479792,
    "CmdUser": 17327000,
    "CmdSys": 5692000
},
The CmdReal, CmdUser, and CmdSys fields show the real, user, and system time spent executing the command. The
Deps field shows the package’s dependencies.
Although we can write our own tool to analyze the actiongraph.json file, we can also use the
https://github.com/icio/actiongraph tool. Install the tool with:
go install github.com/icio/actiongraph@latest
We can find the longest compile steps with:
actiongraph -f actiongraph.json top
 13.786s  16.14%  build github.com/mattn/go-sqlite3
  1.396s  17.78%  build runtime/cgo
  1.327s  19.33%  build github.com/aws/aws-sdk-go/service/s3
  1.295s  20.85%  build github.com/aws/aws-sdk-go/aws/endpoints
  1.095s  22.13%  build github.com/google/go-github/v37/github
  1.078s  23.39%  build github.com/elastic/go-sysinfo/providers/darwin
  0.983s  24.55%  build github.com/open-policy-agent/opa/ast
  0.975s  25.69%  build github.com/klauspost/compress/zstd
  0.916s  26.76%  build github.com/shoenig/go-m1cpu
  0.755s  27.64%  build crypto/tls
  0.742s  28.51%  build github.com/fleetdm/fleet/v4/server/fleet
  0.722s  29.36%  build github.com/shirou/gopsutil/v3/process
  0.664s  30.14%  build net
  0.626s  30.87%  build github.com/open-policy-agent/opa/topdown
  0.625s  31.60%  build runtime
  0.622s  32.33%  build google.golang.org/protobuf/internal/impl
  0.609s  33.04%  build github.com/fleetdm/fleet/v4/server/datastore/mysql
  0.605s  33.75%  build golang.org/x/net/http2
  0.577s  34.43%  build github.com/aws/aws-sdk-go/service/lambda
  0.576s  35.10%  build github.com/spf13/pflag
The tool also has a graph subcommand to highlight all import paths from the build target to the package indicated by
--why. We can convert the .dot file to an SVG file with the Graphviz dot command.
actiongraph -f actiongraph.json graph --why github.com/mattn/go-sqlite3 > actiongraph-sqlite3.dot
dot -Tsvg < actiongraph-sqlite3.dot > actiongraph-sqlite3.svg

Why the go-sqlite3 package is included in the build
We can use this knowledge to refactor the codebase or, perhaps, hide the problematic dependency behind a build flag.
There is no official documentation for the above debug flags. However, they can be found in the Go source code:
    // Undocumented, unstable debugging flags.
    cmd.Flag.StringVar(&cfg.DebugActiongraph, "debug-actiongraph", "", "")
    cmd.Flag.StringVar(&cfg.DebugRuntimeTrace, "debug-runtime-trace", "", "")
    cmd.Flag.StringVar(&cfg.DebugTrace, "debug-trace", "", "")
Further reading
- Previously, we explained how to accurately measure the execution time of Go tests and how to break apart a large Go test suite.
- We also demonstrated some common code refactorings that can be done with your IDE.
Watch how to analyze Go builds
Note: If you want to comment on this article, please do so on the YouTube video.